Azure Monitor Logs Disabled
Risk Level: Low
Description
The plugin checks that the Azure Monitor log is enabled for all the categories of logging and a storage account has been allotted to archive the information. The Azure monitor uses data collected from logs and metrics to identify issues in resources affecting their performance.
About the Service
Monitor: As the name suggests Azure monitor service, allows users to view and analyze all the activities around the azure platform and on-premises environment. Through Azure Monitor, users take an insight of the applications, VMs or containers, visualize the workbooks and dashboards, analyze the Metric analytics and log analytics for issues, respond to alerts and integrate logic apps and export APIs.
Impact
The azure monitor works with the metrics and logs data to help in gaining insights, visualization, analysis, response and integration. It is thus necessary to enable all the logs for gathering all the datas and issues concerning any resource.
Steps to Reproduce
- Log in to the Azure portal.
- Go to Monitor under Services or type “Monitor” in the search box.
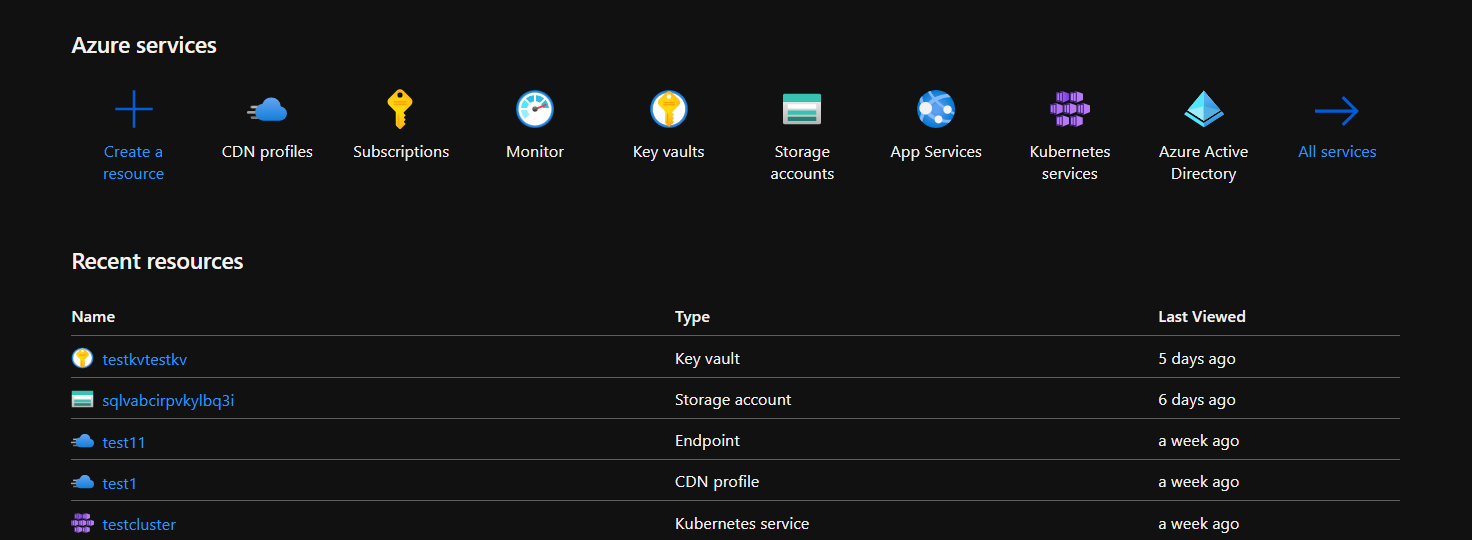
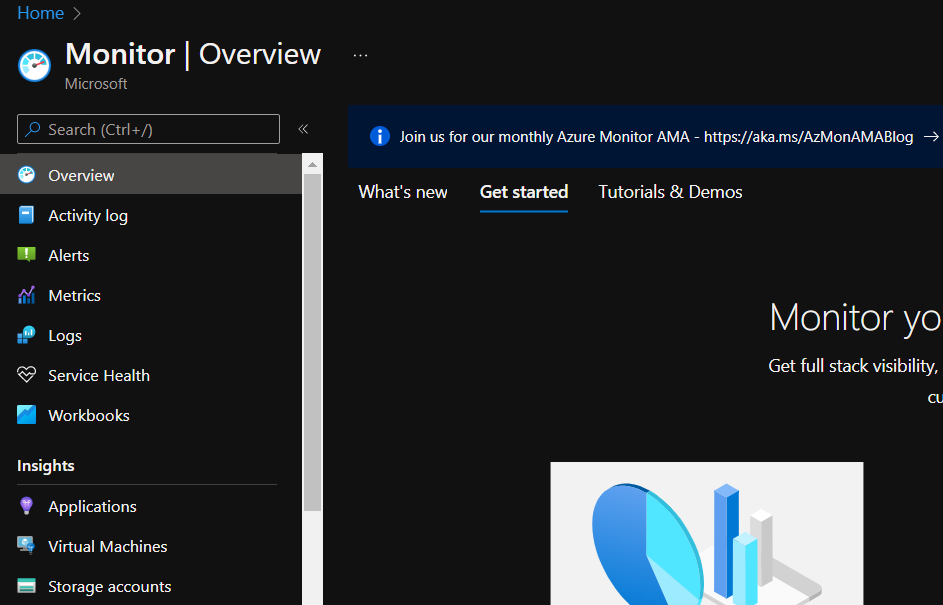
- From the navigation panel, go to Activity log.
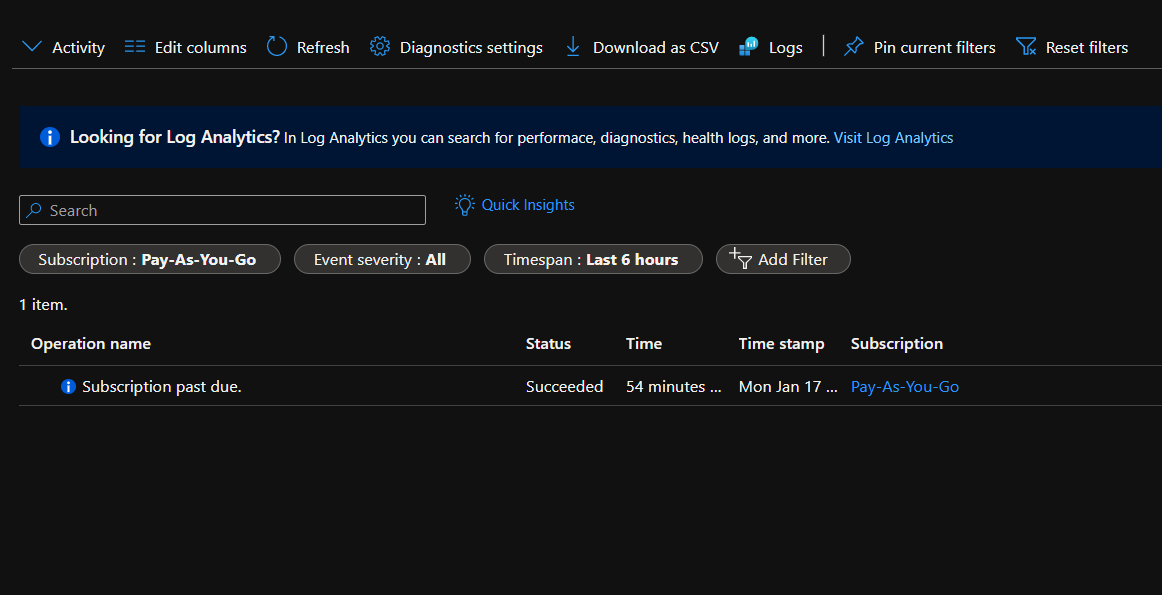
- Click on the diagnostic settings tab.
- Click on the edit settings option given in front of the diagnostic setting.
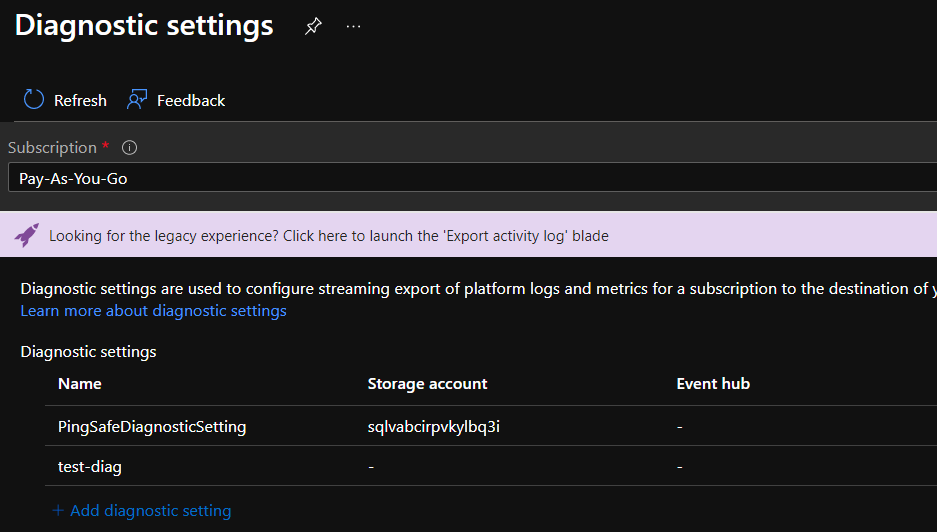
- If under the logs section, all the categories are not enabled, visit the Steps to Reproduce section.
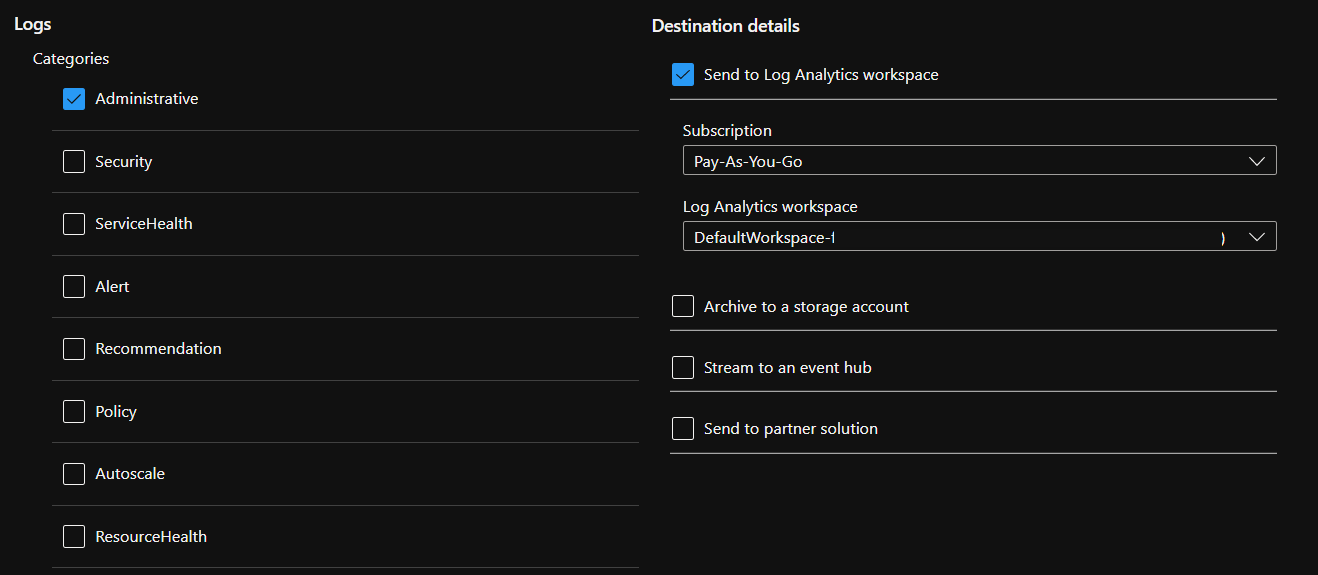
- Repeat the process for other diagnostic settings as well.
Steps for Remediation
- Login to the Azure portal.
- Go to Monitor under Services or type “Monitor” in the search box.

- From the navigation panel, go to Activity log.

- Click on the diagnostic settings tab.

- Click on the edit settings option given in front of the diagnostic setting.

- Under the logs section, select the disabled categories and click on the Save button, given at the top of the page and eliminate the issue.
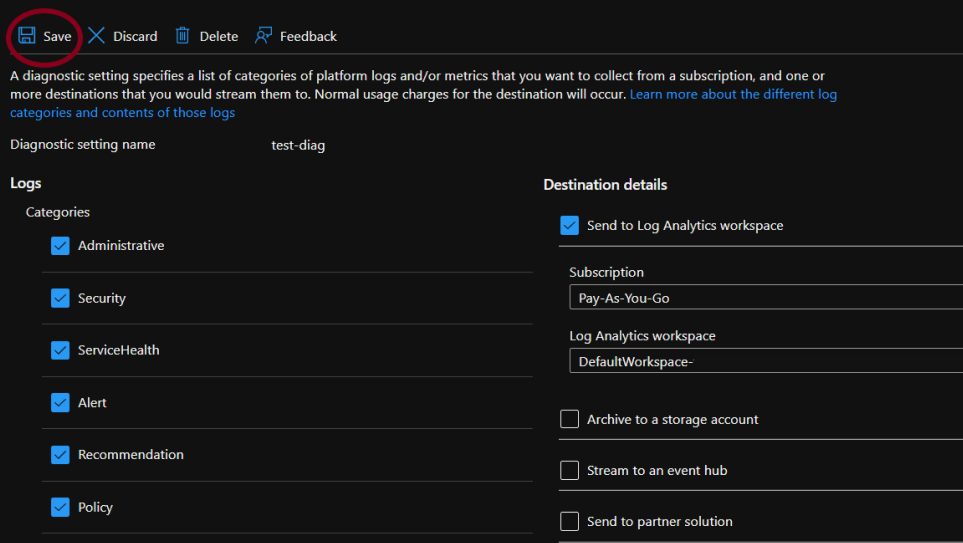
- Repeat the process for other diagnostic settings with this issue as well.
Please feel free to reach out to support@pingsafe.ai with any questions that you may have.
Thanks
PingSafe Support